


Larisa Yarovaya, Anglia Ruskin University and Brian Lucey, Trinity College Dublin
In the last year, the price of Bitcoin has increased from less than US$800 to more than US$12,000. This huge spike in value has many asking if it is a bubble or if the high price today is here to stay.
Finance defines a bubble as a situation where the price of an asset diverges systematically from its fundamentals. Investment mogul Jack Bogle says there is nothing to support Bitcoin, and the head of JP MorganChase, Jamie Dimon has called it a fraud “worse than tulip bulbs”.
Like any asset, Bitcoin has some fundamental value, even if only a hope value, or a value arising from scarcity. So there are reasons to hold it. But our research does show that it is experiencing a bubble right now.
Together with Shaen Corbet at Dublin City University, we took as the fundamentals of Bitcoin elements of the technology that underpins it (and other cryptocurrencies). We looked at measures, which represent the key theoretical and computational components of how cyrptocurrencies are priced.
New Bitcoin is created by a process of mining units called blocks. Bitcoin is built on blockchain technology – a digital ledger of transactions – which enables the currency to be traded independently from any central banking system, without risk of fake or duplicate Bitcoins being used. Instead of having a bank verify pending transactions (a “block”), miners check them and, if approved, the block is cryptographically added to the ever-expanding ledger.
So the first measure we examined relates to mining difficulty. It calculates how difficult it is to find a new block relative to the past. As per the Bitcoin Protocol, the number of Bitcoin is capped at 21m (there are currently 16.7m in circulation). This means that as more people mine for Bitcoin and more blocks are created, each block is, all things being equal, worth less than the previous block.
shutterstock.com
The second measure we looked at relates to the “hash rate”. This is the speed at which a computer operates when mining. To successfully mine Bitcoin, you must come up with a 64-digit hexadecimal number (called a “hash”), which is less than or equal to the target hash. The faster you can do this, the better chance you have of finding the next block and receiving payment.
The third measurement was “block size”. This relates to how large the chain is at any given time, with larger chains taking longer to mine than shorter ones.
And lastly we looked at the volume of transactions conducted. Any asset, in particular any currency, which is more widely used will be more valuable than one which is used less frequently.
In our study, we examined data from Bitcoin’s early days – from July 2010 to November 2017. The price of one Bitcoin did not rise above US$1 until April 16, 2011, then to US$10 on June 3, 2011 and US$100 on April 2, 2013. Since then the price rise has clearly been exceptional.
We then applied an accepted method that is used to detect and date stamp bubbles after they burst. In essence, this involves identifying the existence of an explosive component in a series. As the series, here the price of bitcoin, “explodes”, it runs the risk, like any explosion, of flying apart.
A possibly counter-intuitive result of this approach is that if a fundamental driver and the price of an asset both show an explosive component, we might not conclude a bubble is present. A bubble is when something deviates from its fundamental value. If the fundamental value is itself growing explosively then the price would also.
Think of dividends on a stock. If, somehow, these were to grow at an explosive rate we might expect to see the price do the same. While unsustainable, this is not technically a bubble. To overcome this, we then date stamp a bubble as being present when the price shows an explosive component and the underlying fundamentals do not.
Here are the results of the analysis:
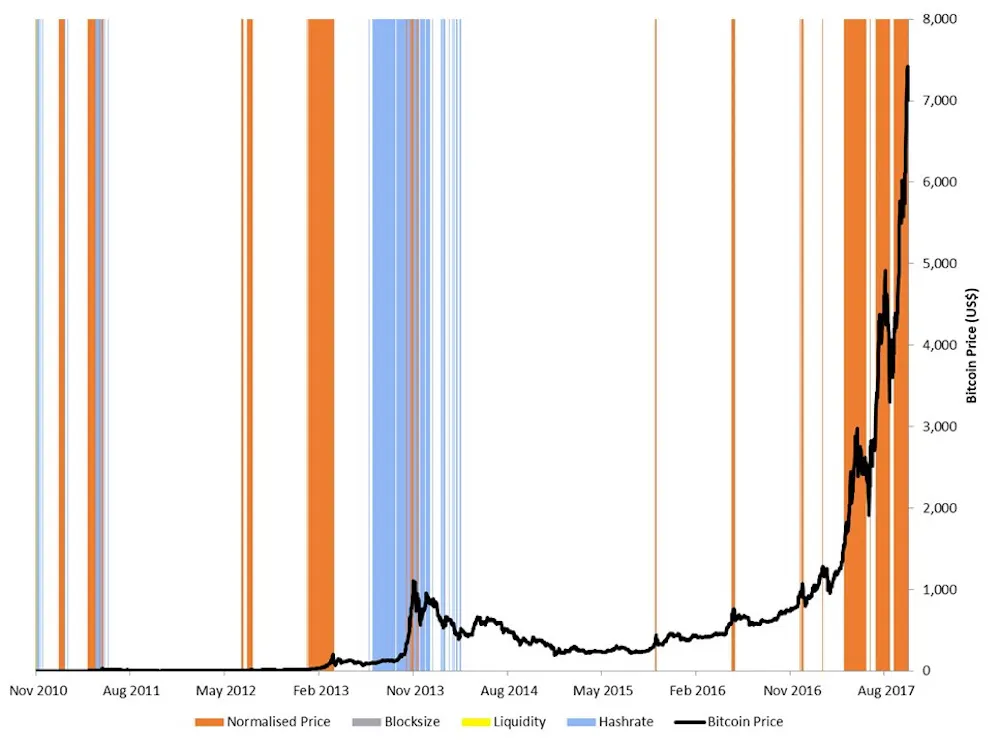
Authors own calculations
The orange lines denote when the price is showing explosive behaviour. We also see a period where the hash rate was growing explosively – the blue columns in late 2013 and early 2014. This is also an indication of a price bubble, which went on to burst.
So there are clear points where bubbles are visible – including now. The price of Bitcoin at present shows explosive behaviour in the absence of anything similar in its fundamentals. We see the price moving upwards in a manner that is not related to the technical underpinnings. It is a clear bubble.
A weakness of these tests and indeed all bubble identification tests is that they take place after the bubble has burst. Even this test, which can be redone as swiftly as new data arrives, is such. Bubbles by their nature grow in a compound manner – so even a day or two delay in addressing the situation can make a bubble significantly worse.
![]() What is not yet available is an accurate advanced warning bubble indicator. In its absence, this approach may be the best. Unfortunately, we cannot use this approach to determine the extent of the bubble. There is no well-accepted model that suggests a “fair” value for Bitcoin. But whatever that level is, it is almost certain that, at present, it is well below where we are now.
What is not yet available is an accurate advanced warning bubble indicator. In its absence, this approach may be the best. Unfortunately, we cannot use this approach to determine the extent of the bubble. There is no well-accepted model that suggests a “fair” value for Bitcoin. But whatever that level is, it is almost certain that, at present, it is well below where we are now.
Larisa Yarovaya, Lecturer in Accounting and Finance, Anglia Ruskin University and Brian Lucey, Professor of International Finance and Commodities, Trinity College Dublin
This article was originally published on The Conversation. Read the original article.


